関数create_1DvelocityStructure_JMA2001_Vp マニュアル

(The documentation of function create_1DvelocityStructure_JMA2001_Vp)

Last Update: 2024/9/20


◆機能・用途(Purpose)

JMA2001(上野他, 2002)の1次元P波速度構造を作成する。
Create a 1D P-wave velocity structure of JMA2001 (Ueno et al., 2002).


◆形式(Format)

#include <ray/initialize.h>
inline struct _1DvelocityStructure create_1DvelocityStructure_JMA2001_Vp
(const char ∗unit)


◆引数(Arguments)

unit 戻り値の単位。以下の選択肢が利用できる。
The unit of the return value, which can be one of the followings.
  • "m" : 深さをm単位、速度をm/s単位で返す。
    Return the depths in [m] unit, and velocities in [m/s] unit.
  • "km" : 深さをkm単位、速度をkm/s単位で返す。
    Return the depths in [km] unit, and velocities in [km/s] unit.


◆戻り値(Return value)

JMA2001を近似したP波速度構造を表す構造体。 戻り値のメンバの値は以下のようになる。
A structure which represents an approximated P-wave velocity model of JMA2001. The values of members of the return value are as follows.

戻り値のメンバ
Member of the return value

Value
N 28
depths 28個の速度定義点の深さを浅い方から順に並べた配列。
An array composed of the depths of 28 velocity definition points, sorted from shallower to deeper.
velocities 28個の速度定義点でのP波速度を浅い方から順に並べた配列。
An array composed of the P-wave velocities of 28 velocity definition points, sorted from shallower to deeper.
slope_shallow 最も浅い2つの速度定義点間のP波速度勾配。
The P-wave velocity slope between the two shallowest velocity definition points.
slope_deep 最も深い2つの速度定義点間のP波速度勾配。
The P-wave velocity slope between the two deepest velocity definition points.


◆使用例(Example)

struct _1DvelocityStructure Vp =create_1DvelocityStructure_JMA2001_Vp("km");


◆補足(Additional remarks)

JMA2001(気象庁ホームページ) では深さ0 kmから939.5 kmまでのP波・S波速度が0.5 km刻みで与えられている。 その結果、速度定義点の個数は1880点にもなり、 このまま扱うのは波線計算におけるコンピュータ負荷が大きい。 また、速度値は小数点以下3桁のkm/s単位で与えられているが、 隣接する速度定義点で速度値が完全に等しい区間が存在し、 そのようなケースでは速度勾配が0となって波線計算に支障を来す。 そこでこの関数ではJMA2001を28点で近似した速度構造を生成する。 これは下表の通りである。
The JMA2001, in the website of the Japan Meteorological Agency, gives P- and S-wave velocities at 0.5 km intervals from 0 km to 939.5 km below the ground surface. This results in a total of 1880 velocity definition points, and directly treating it in the ray calculation would cause a large machine load. Also, there are several sections where the velocity values at adjacent depths are exactly same within the given accuracy of 3 decimals in km/s unit, causing a zero velocity gradient which is problematic to the ray calculation. To avoid these issues, this function generates a velocity structure which is an approximation of JMA2001 by 28 points, as shown below.

深さ(km)
Depth (km)
P波速度(km/s)
P-wave velocity (km/s)
S波速度(km/s)
S-wave velocity (km/s)
0.04.8002.844
1.55.2203.088
2.55.4503.221
4.05.7203.375
5.05.8203.431
15.06.2203.634
22.06.5443.803
34.07.1884.140
41.07.4944.294
44.07.5984.344
48.07.6884.382
52.57.7504.403
65.07.8454.419
80.57.8914.420
252.58.4234.679
349.58.7494.847
370.58.8354.895
391.58.8854.922
420.09.0295.002
447.59.2105.102
535.09.8495.457
585.010.1645.631
630.510.4055.765
690.010.6735.913
732.010.8265.998
809.511.0286.110
870.011.1276.165
939.511.1996.204

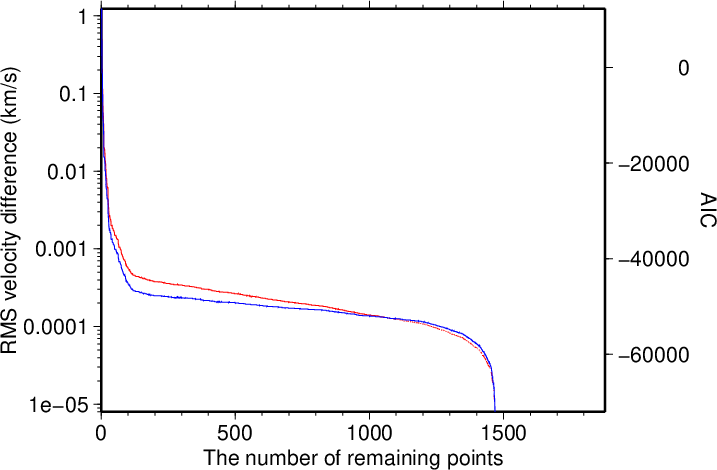
この構造は以下のようにして決定したものである。 まず、元々の速度定義点1880点からいずれか1点を試しに除いてみる。 除いた点の速度は両側の速度定義点の速度の線形補間値で置き換える。 これによる元の速度構造との差の2乗和を計算し、 その増加量が最も小さい1点を実際に取り除く。 これにより、1879点から成る近似速度構造が得られる。 次にその構造からもう1点を同様の考え方で取り除いて 1878点から成る近似速度構造を作成する。 以下同様に1点ずつ減らしていき、 最終的に両端(深さ0 kmと939.5 km)を1本の直線で結んだ速度構造が得られる。 作成した近似速度構造と元の速度構造との差のRMSを取ってプロットすると 図1の赤線のようになる。 ここで横軸は各近似速度構造における残っている速度定義点の個数である。
This structure was determined by the procedure as below. First, one of the original 1880 velocity definition points is removed by trial. The velocity at the removed point is replaced by the linear interpolation value of the velocities at the bounding velocity definition points. A square sum of the difference between the original and resultant velocities is calculated, and the best point to be removed, which causes the minimum increase of the difference, is determined. Adding this point results in an approximated velocity model of 1879 points. Then from it, another point is removed by the same way as above to generate an approximated velocity model of 1878 points. This procedure is repeated to finally create a velocity model which is a straight line connecting the both ends at 0 km and 939.5 km from the ground surface. The root mean square difference between the original and approximated velocities is shown by the red line of Fig. 1, where the lateral axis is the number of remaining velocity definition points in the approximated models.


図1. 近似した速度構造と元の速度構造との差のRMS(赤線)およびAIC(青線)。
Fig. 1. The root mean suqare difference between the approximated and original velocity models (red) and AIC (blue).

図1において左下に凸に折れ曲がっているところは 比較的少数の速度定義点を用いて元の構造を比較的よく近似できていることを表す。 図1の赤線にはそのような場所が2ヶ所あり、 拡大してみると速度定義点が28個のときと119個のときである。 また参考までに速度定義点の数をモデルパラメータ数に見立てて AICを計算してみた結果(青線)においても 全体に右下がり(速度定義点が多ければ多いほど良いという結果)になってしまったものの、 速度定義点の個数が28個と119個のときに 比較的少ない速度定義点で比較的小さいAICを実現できていることが分かる。 なお今回は速度定義点での速度は元の値をそのまま用いているので AICの考え方が使えるかは不明であり、あくまで参考値として示すものである。
The bending points that sticks out to the lower left direction in Fig. 1 indicates that the original structure is relatively well approximated by a relatively small number of velocity definition points. There are two such points in the red line of Fig. 1, which are 28 and 119 velocity definition points according to an enlarged plot (not shown here). AIC calculated by regarding the number of velocity definition points as the number of model parameters (blue) shows a monochromatically decreasing trend, indicating that the larger the number of velocity definition points, the better the approximation. However, AIC also shows bent at 28 and 119 velocity definition points, meaning that relatively small AIC values are realized by relatively small number of velocity definition points. Note, however, that AIC may not be proper in this estimation, as the velocities at the definition points were not estimated but just the original values were used.

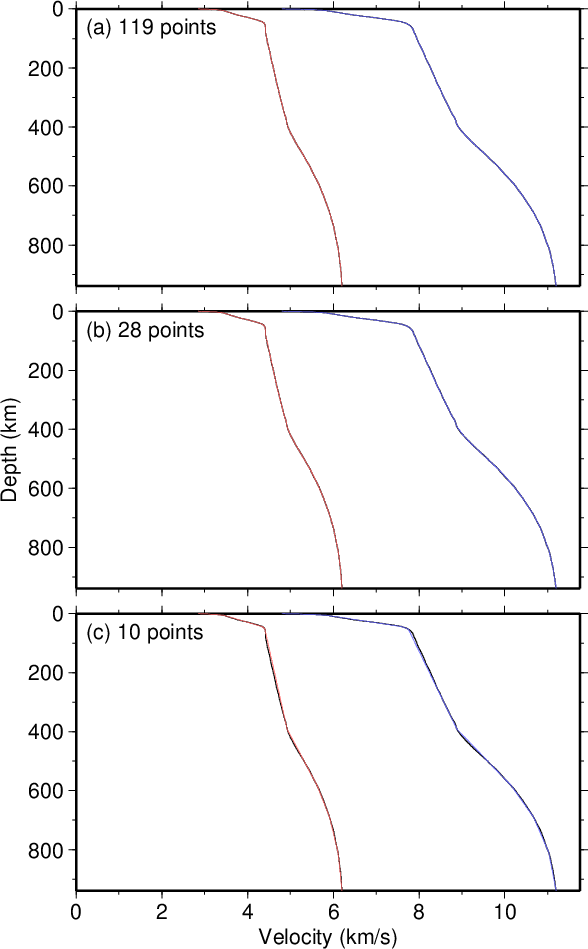
近似した速度構造と元の速度構造の比較を図2に示す。 元の構造を黒線でプロットし、その上に近似構造を青線(P波)および赤線(S波)で示している。 図2aは119点の場合、図2bは28点の場合である。 28点の場合であっても元の構造との違いが見た目に分からないレベルで 一致していることが分かる。 このことから28点で十分と判断した。 なお図1を拡大してみると10点のところにも折れ曲がりが見つかったが、 この場合には元の構造とのずれが見えてくる(図2c)。 以上から28点の近似構造を採用した。
Fig. 2 shows a comparison of the approximated and original velocity models. The original structure is plotted by black, above which the approximated structures are plotted by blue (P-wave) and red (S-wave). Fig. 2a and 2b are results from 119 and 28 points, respectively. The two models are almost the same, with only an invisible difference, even in case of the 28 points. Therefore the 28 point model is considered to be accurate enough. In an enlarged version of Fig. 1, another bending point was found at 10 points. In this case, however, the approximated model showed a visible difference from the original one (Fig. 2c). Based on these investigations, the 28 point model was adopted.


図2. 元々の速度構造(黒)と近似した速度構造(青:P波、赤:S波)の比較。
Fig. 2. A comparison of original (black) and approximated (blue: P-wave, red: S-wave) velocity structures.


◆引用文献 (References)